The Weighing Machine
“In the short run, the market is a voting machine but in the long run, it is a weighing machine.” - B Graham. Having recently looked at the voting of the market, this note looks at the fundamentals.

Introduction
Around 80 years ago, Benjamin Graham—affectionately known as the father of value investing—quipped the following as he reflected on how the stock market was prone to deviate, often substantially, from its fundamentals, driven by factors such as investor sentiment, narratives, and other “technical factors.”
However, with time, what matters is the fundamentals of the business since ultimately the share price is the summary (or net present value) of a company’s future cumulative earnings attributable to shareholders.
“In the short run, the market is a voting machine but in the long run, it is a weighing machine.”
― Benjamin Graham
Voting vs. Weighing
In our last post - Echoes of Bob Farrell - we went over some of the factors that Graham could conceivably have described as measuring the “Voting” (although realistically he wasn’t very concerned with these). In this post, we will take a look at some factors which fall under the “weighing.” We do this in two principal ways: first, we look across a number of select fundamentals, and second, we look at valuations.
All of this work is focused on the US equity market because it is the dominant one globally today and therefore of the most importance to most investors. Importantly, however, the findings regarding the US market are far from universally applicable to equity markets elsewhere, since in a similar fashion to 2000, there are very broad divergences. These mean that the potential for returns equally vary.

Key Findings
The conclusion from this basic exercise is simply that the weighing machine suggests that fundamentals are unlikely to improve substantially while valuations are extremely stretched in a long-term historical context.
Although the voting machine findings were negatively biased, they left some room for further enthusiasm before matching the most extreme historic precedents. This is not the case for valuations, which today are in the 95th–99th percentile over the past 125 years. There have been no examples in the past where buying equities at comparable levels would generate good medium- or long-term returns.
In that sense, we would suggest that buying and owning substantial amounts of US equities today is the equivalent of picking up pennies in front of an approaching steamroller. Warren Buffett, as ever, put it best: “The stock market is a device for transferring money from the impatient to the patient.”

Some Perspective on Fundamentals
By necessity, this article deals with generalizations and aggregates; it isn't meant to be a complete and fully detailed diagnosis. Rather, it aims to reach relevant insights through the analysis of some select, important fundamental factors which historically have been instructive in driving overall outcomes.
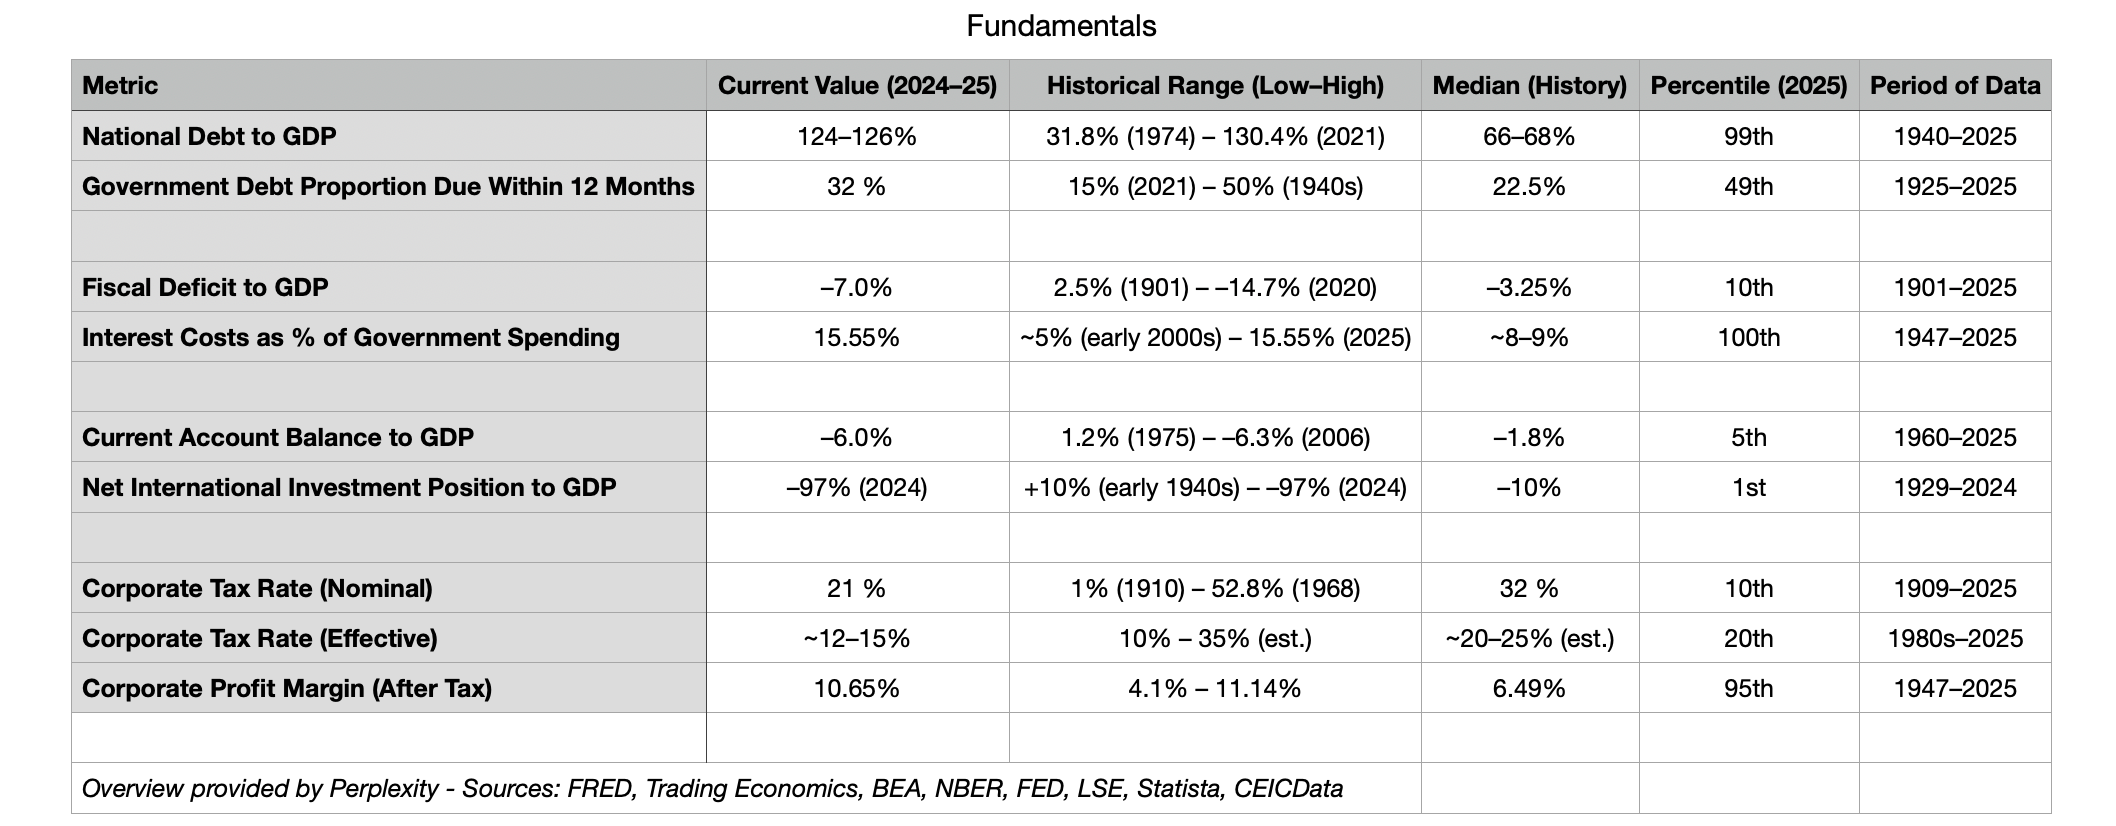
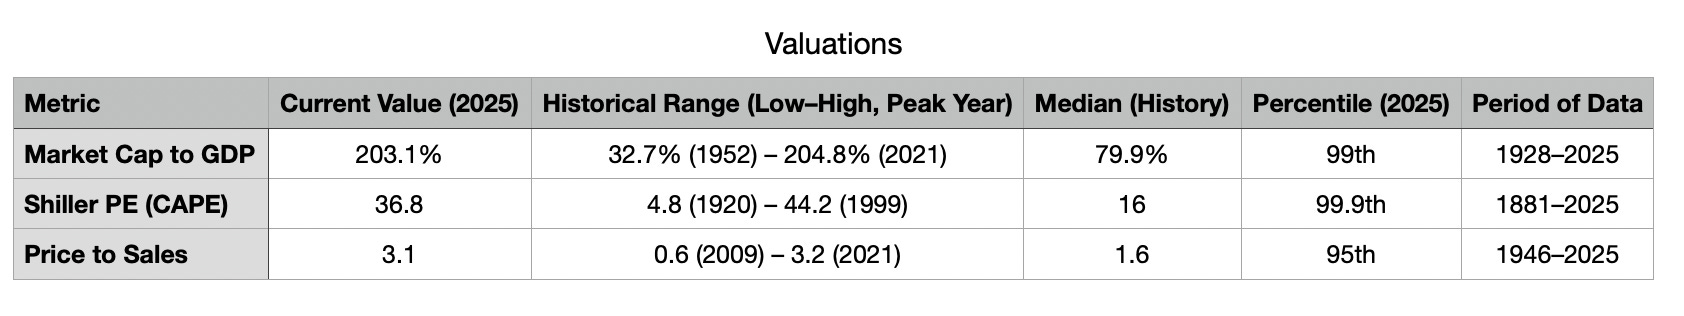
These factors are shown statistically in the table (see attached) and discussed individually below. They were selected based on their ability to ultimately influence the stock market’s aggregate sales, earnings, and cashflow paths while also considering returns on capital achieved and the risks involved.
National Debt
Debt is an important element in all these since a heavy debt load is like carrying a big rucksack full of rocks—it slows you down. Moreover, debt has preference in the capital allocation stack, meaning that it must be serviced before equity holders can make their claims. If the debt load is heavy, the risks from changing costs of borrowing and the division of resources towards interest costs are important to understand for the equity holder. At a country level, the picture is analogous yet different; still, what remains is that very high debt loads tend to reduce the growth potential of a country, certainly on a “hard currency basis.” That, in turn, matters for companies which grow their business within the economy.
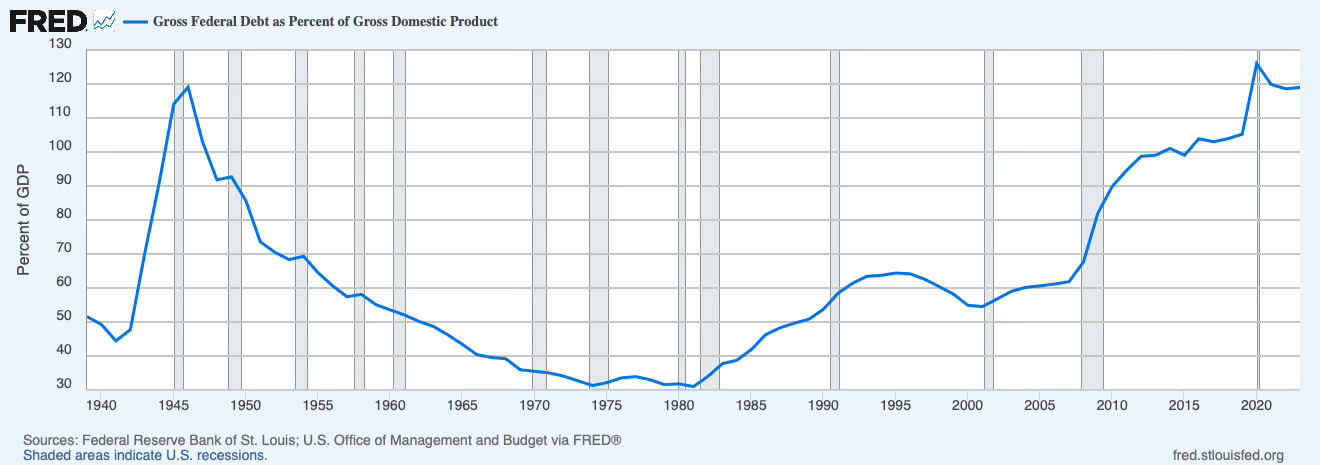
As frequently discussed, the current level of debt is unprecedented outside of wartime. By itself, this suggests a slower level of growth going forward. In addition, we should note that the duration of this debt is increasingly short-term, which adds “market risk” to the management. In fact, the proportion of the debt due within a year is now by far the highest since 1950.
Fiscal Deficits
The discussion of government spending is all-precedent these days, so we don't need to spend too much time on diving into the gory detail. Still, it is worth reciting that at 7% of GDP, it has only been higher less than 10% of the time since 1901. By its very nature, a deficit, of course, means that the government is adding to the above debt burden on an ongoing basis.
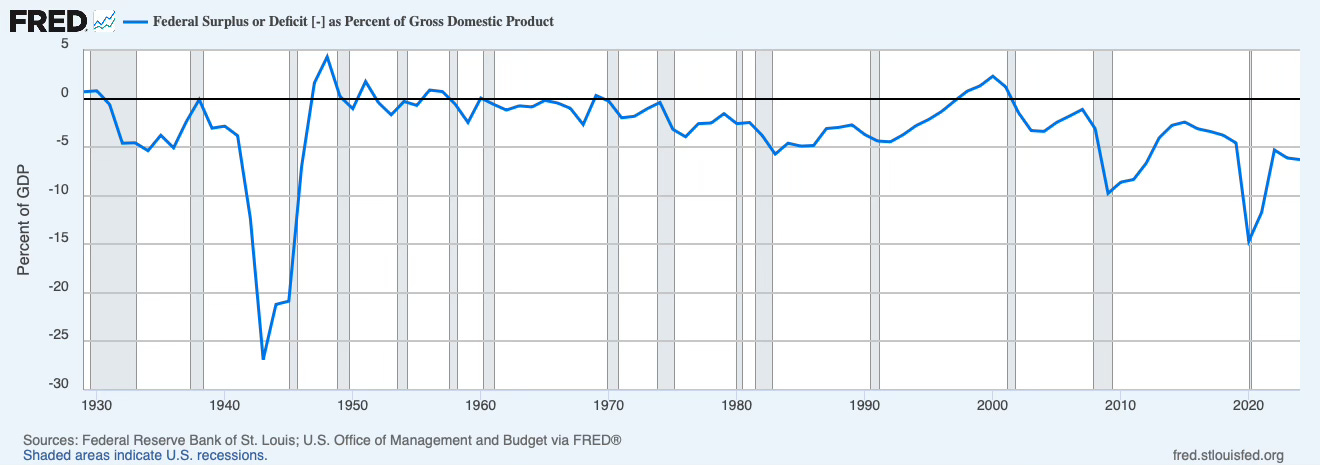
Adding insult to injury, it is also worth highlighting that the government today is spending more on interest costs than at any other time since World War II and close to 2x the median level.

The debt and fiscal numbers together suggest we are either already in a debt trap/under fiscal capture or very close to such a situation (i.e., where the debt will continue to rise and become unsustainable almost regardless of actions taken).
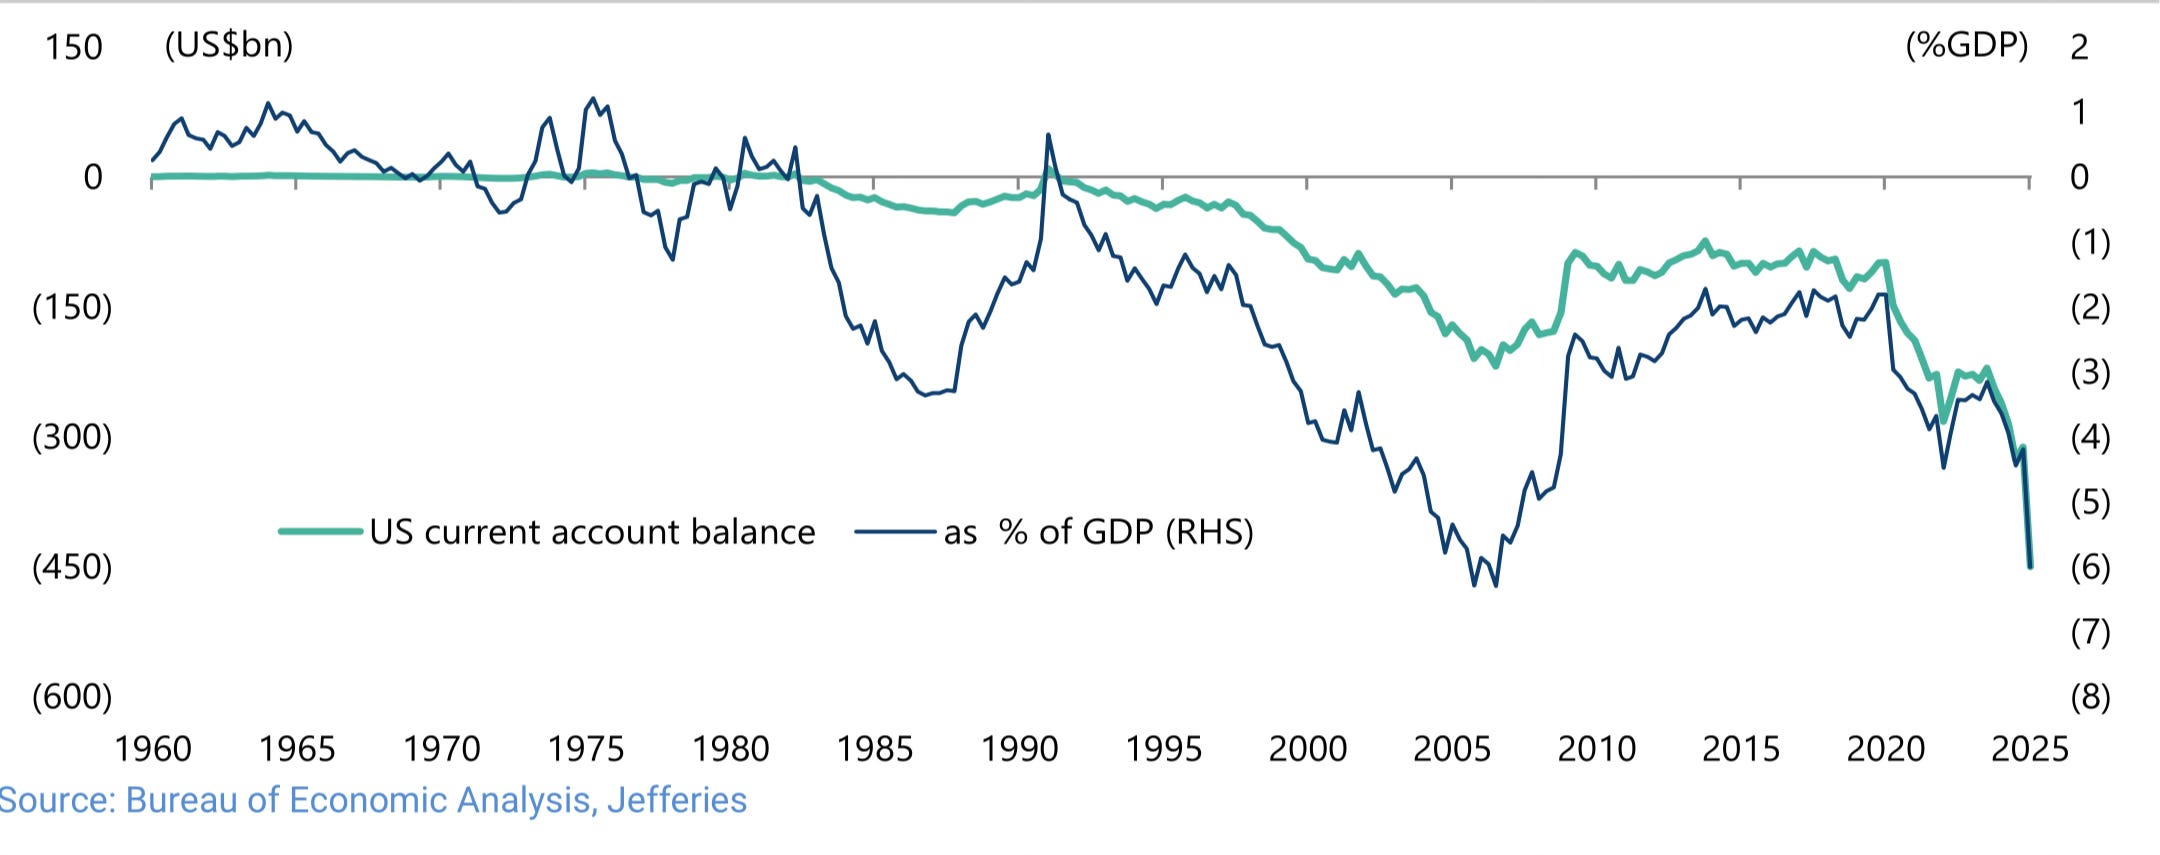
Current Account
The above data highlights how the US is in an increasingly precarious situation where large amounts of savings are necessary to support current levels of spending. Unfortunately, the country doesn't have such resources, as indicated by the Current Account, which, when in deficit, effectively shows that a country is growing faster than its domestic savings can support. Although clearly impacted by front-running of tariffs, it is worth highlighting that the current account deficit has never been worse than Q1 2025.
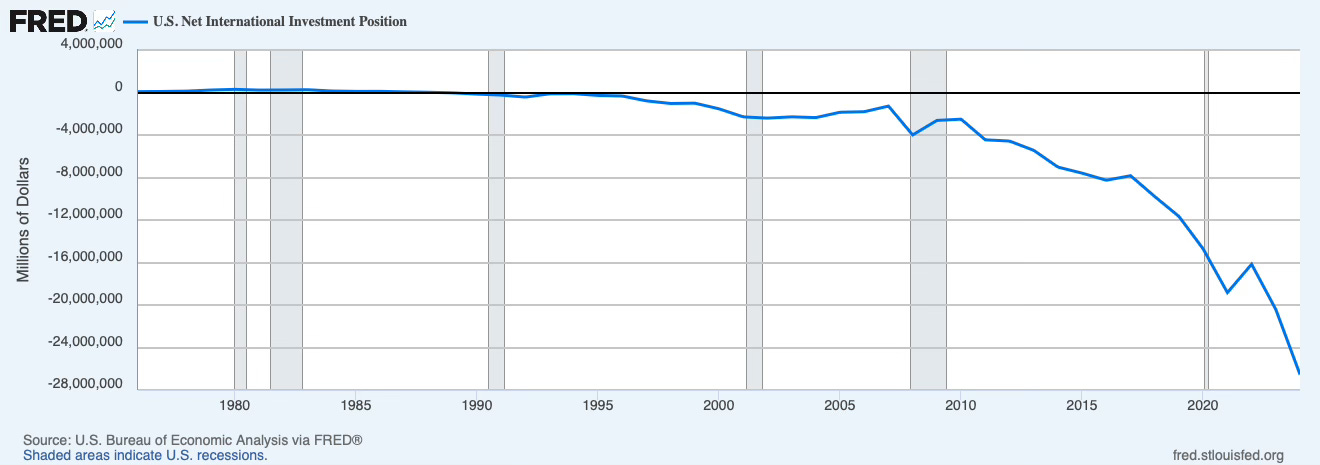
Net International Investment Position
All of this may not be too bad if foreigners remain willing to support “The American project” and are not too heavily invested already. After all, America is supposedly exceptional and the hegemony.
Unfortunately, this outcome is more likely to be what has already happened rather than what lies ahead. The NIIP at -97% of GDP is simply enormous and at a historic record, almost 10x the median value since 1929.
Consequently, the US is extremely exposed to the changing attitude of foreign creditors and investors at a time when she has been changing her behaviour and attitude towards these very lenders. There are signs that they are beginning to scale back on their commitments to USD financial assets just at the very time where the need for further support is historically the greatest.
Corporate Tax Rate
But maybe a way out of the above trouble at the sovereign level lies with corporates, which everyone says are in great shape? This seems plausible as far as corporate taxation is concerned, in the sense that current levels are low by historical standards. Of course, there are no plans at all to raise these.
Corporate Margins
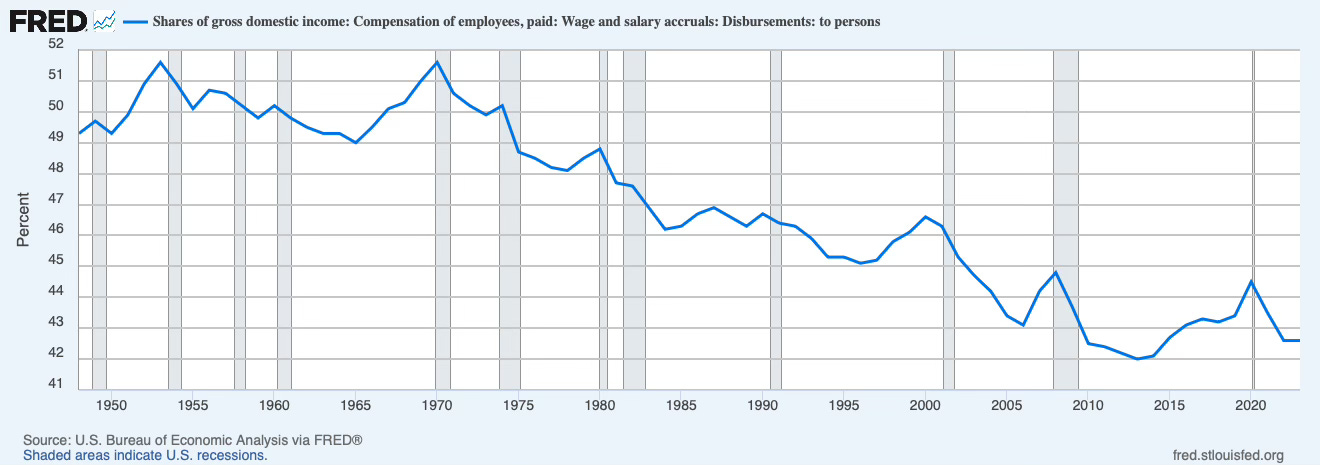
It is a plausible argument that the flip side to government spending has been private sector benefits (see, for example, the Kalecki profit equation—a well-known economic theory). In one sense, we can conclude that by looking at corporate after-tax margins, which very rarely have been higher since the second world war. Measured more broadly, profits as a share of the economy are at their highest since the second world war.
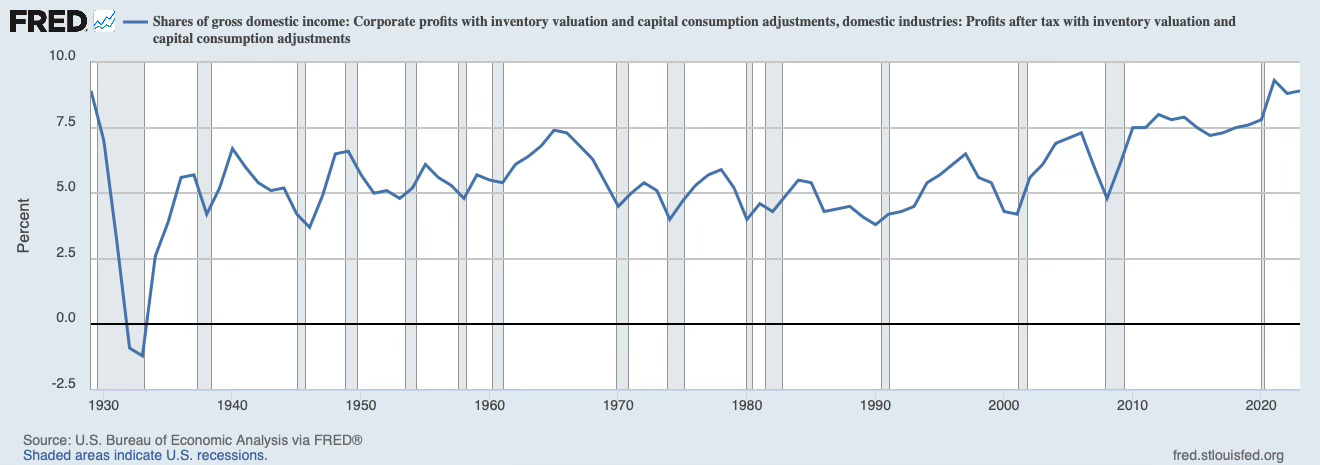
Meanwhile labor’s share of profit—in a similar way to tax—is also at a long-term depressed level.
There are many factors which feed into corporate profitability, but assuming that today government spending and tax are among the most important, and having looked at the state of the government balance sheet, we might not be able to conclude that corporate profits are about to collapse. Nonetheless, we can say that it would seem highly unlikely that they should grow proportionately over the medium and long-term from their current levels.
Summary
The fundamental picture in America today is historically grim. Simplistically, the country needs better government fundamentals, but things have deteriorated to such an extent that any improvement would likely result in a big negative impact on corporate profits.
Indeed, probabilistically, we are at such extended levels of indebtedness and fiscal spending that simply sustaining where we are without meaningfully impacting growth seems highly optimistic. Literally pinning all hope on this time being different. Timing as ever is the challenge, but our best guess is that we are getting close to the point where things come to a head.

An Examination of Valuations
Valuations reflect the consensus perspective on the above (and other) fundamentals. The more positive a view, the higher the valuations and, in turn, the higher the bar for the actual fundamentals to match or exceed the expectations. And of course, vice versa. As we will see, the prevailing common view is a lot more positive than what we concluded from our analysis of the fundamentals, indicating that an opportunity for active investors currently exists.
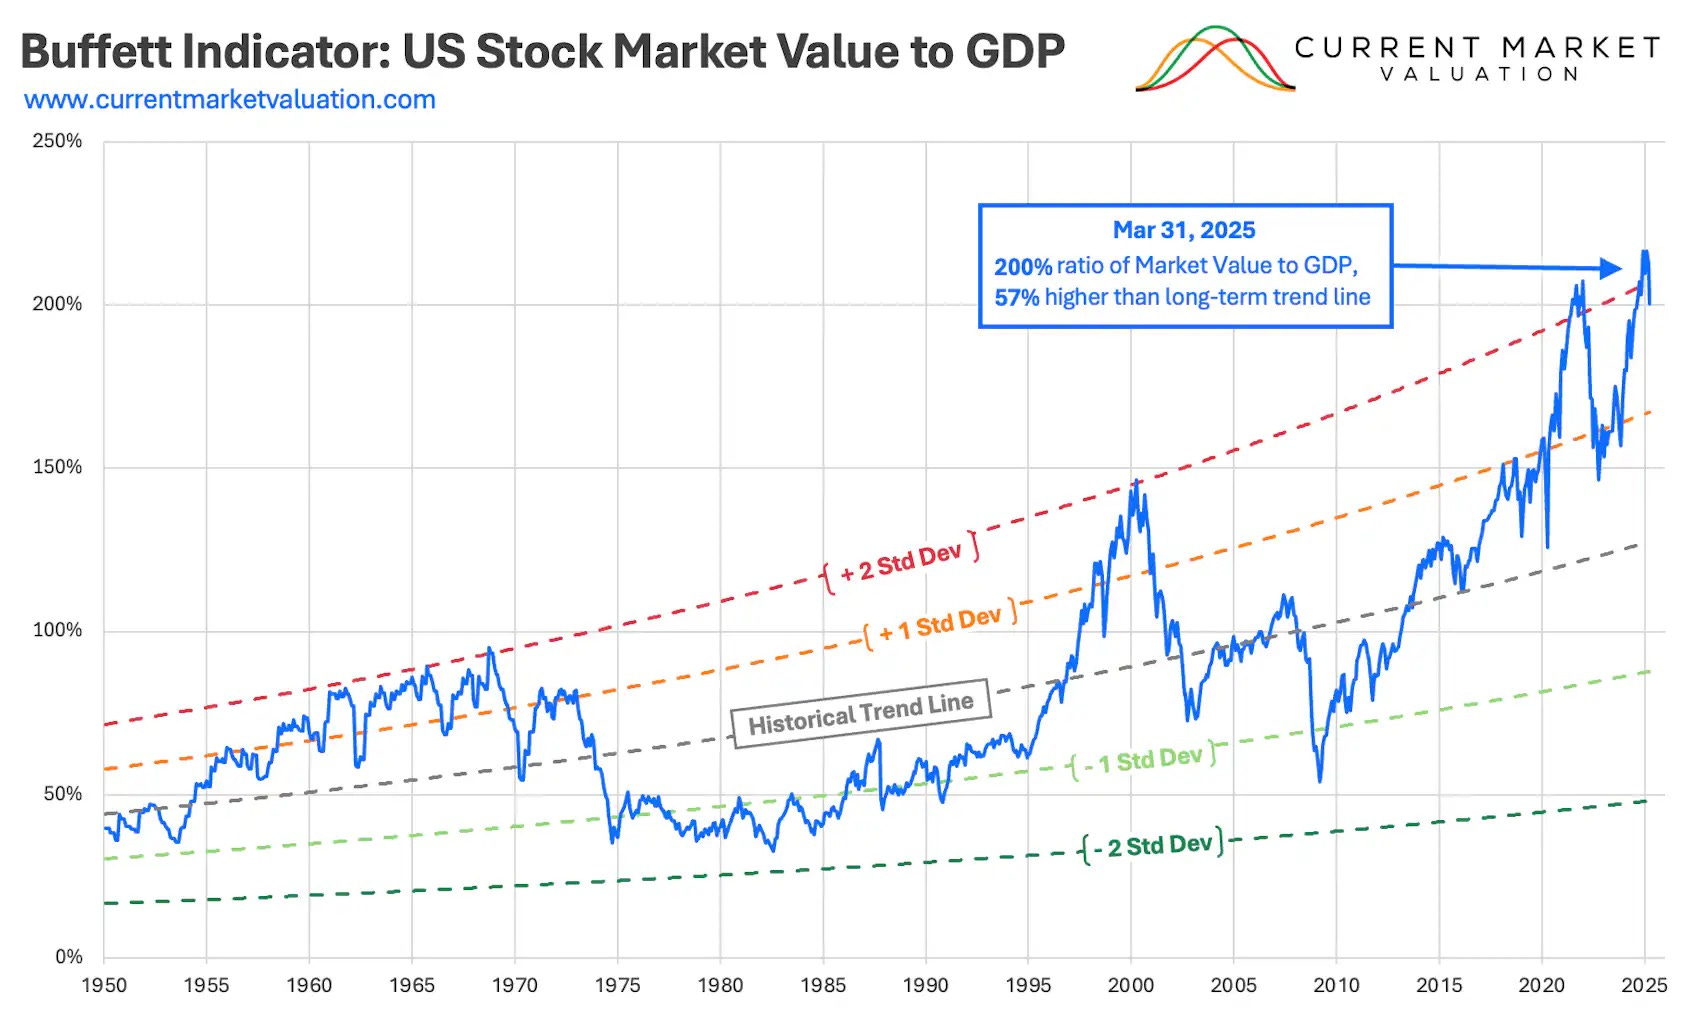
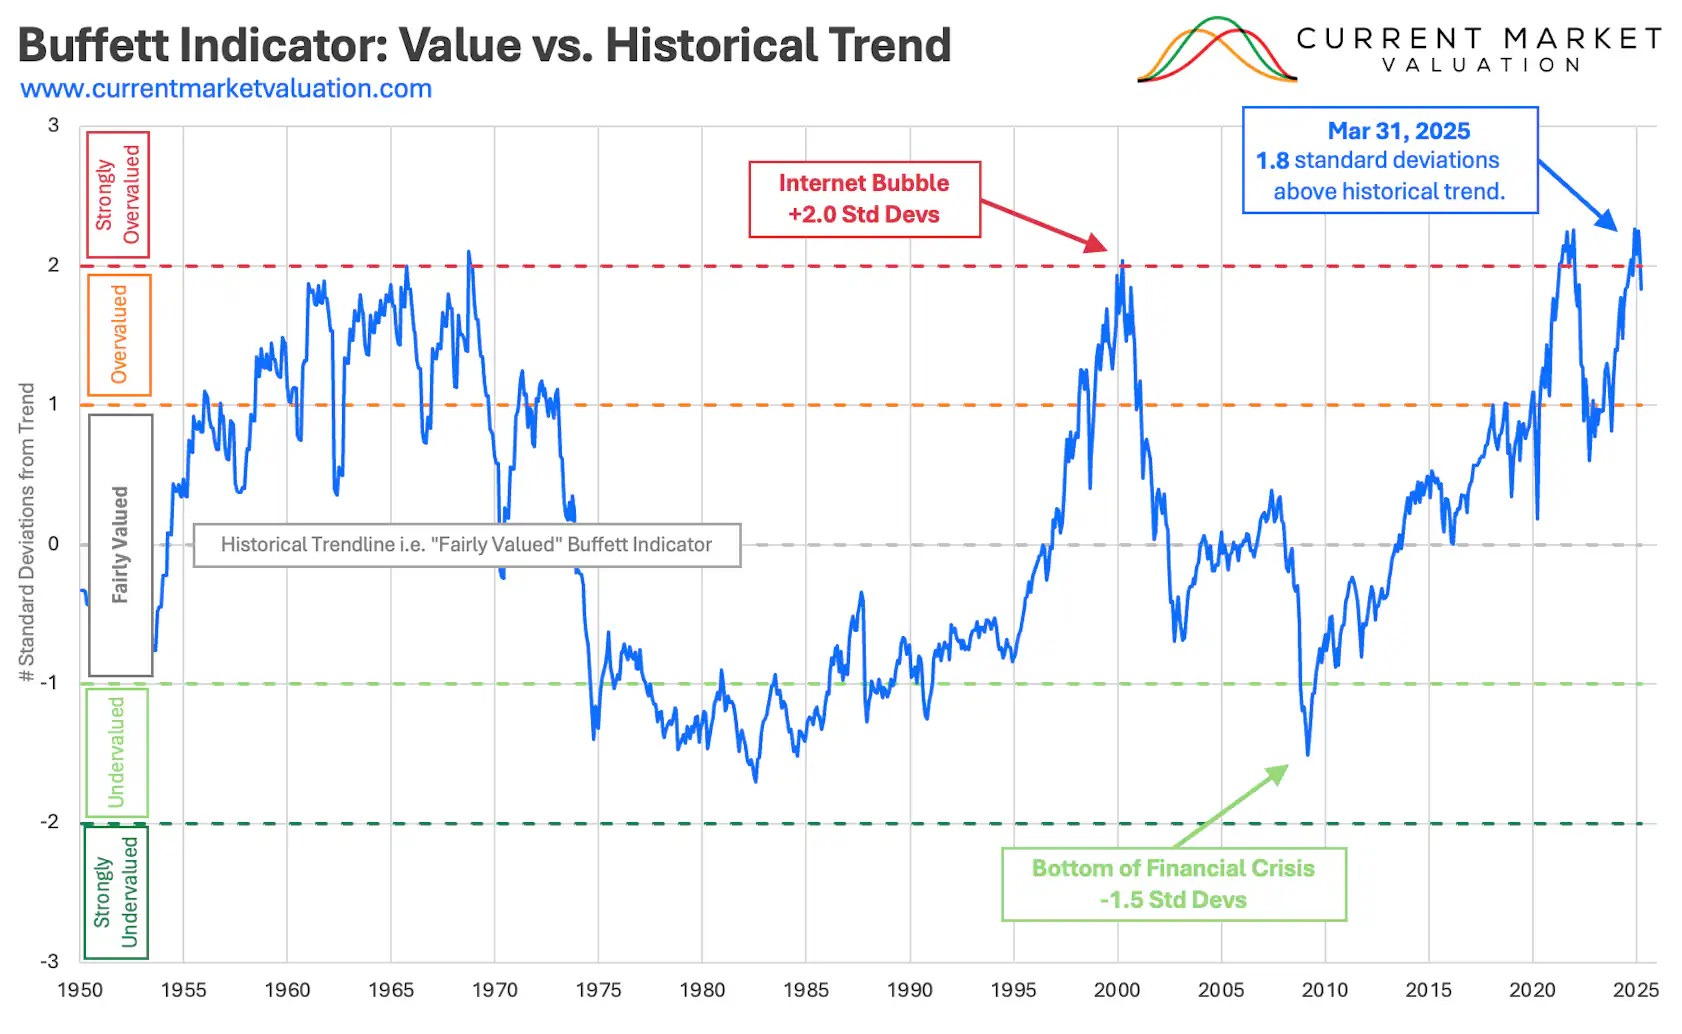
Market Capitalisation to Gross Domestic Product
Allegedly Warren Buffett’s favorite long-term (is there any other investment horizon he may say) indicator of valuation, this ratio has gone through all previous highs by some distance during the period of unorthodox policy seen since 2009. Today, it is so elevated that Buffett has raised the cash level at Berkshire Hathaway to an unprecedented 30% of total assets or more than $300bn.
Cyclically Adjusted Price to Earnings Ratio
Robert Shiller has done extensive work on all sorts of relevant valuation measures for houses as well as equities. He has concluded that for the long-term, investors are best served by focusing on the CAPE ratio, which builds in the impact of inflation and dividends/payouts; on his website, he produces (and shares) data going back to 1871.
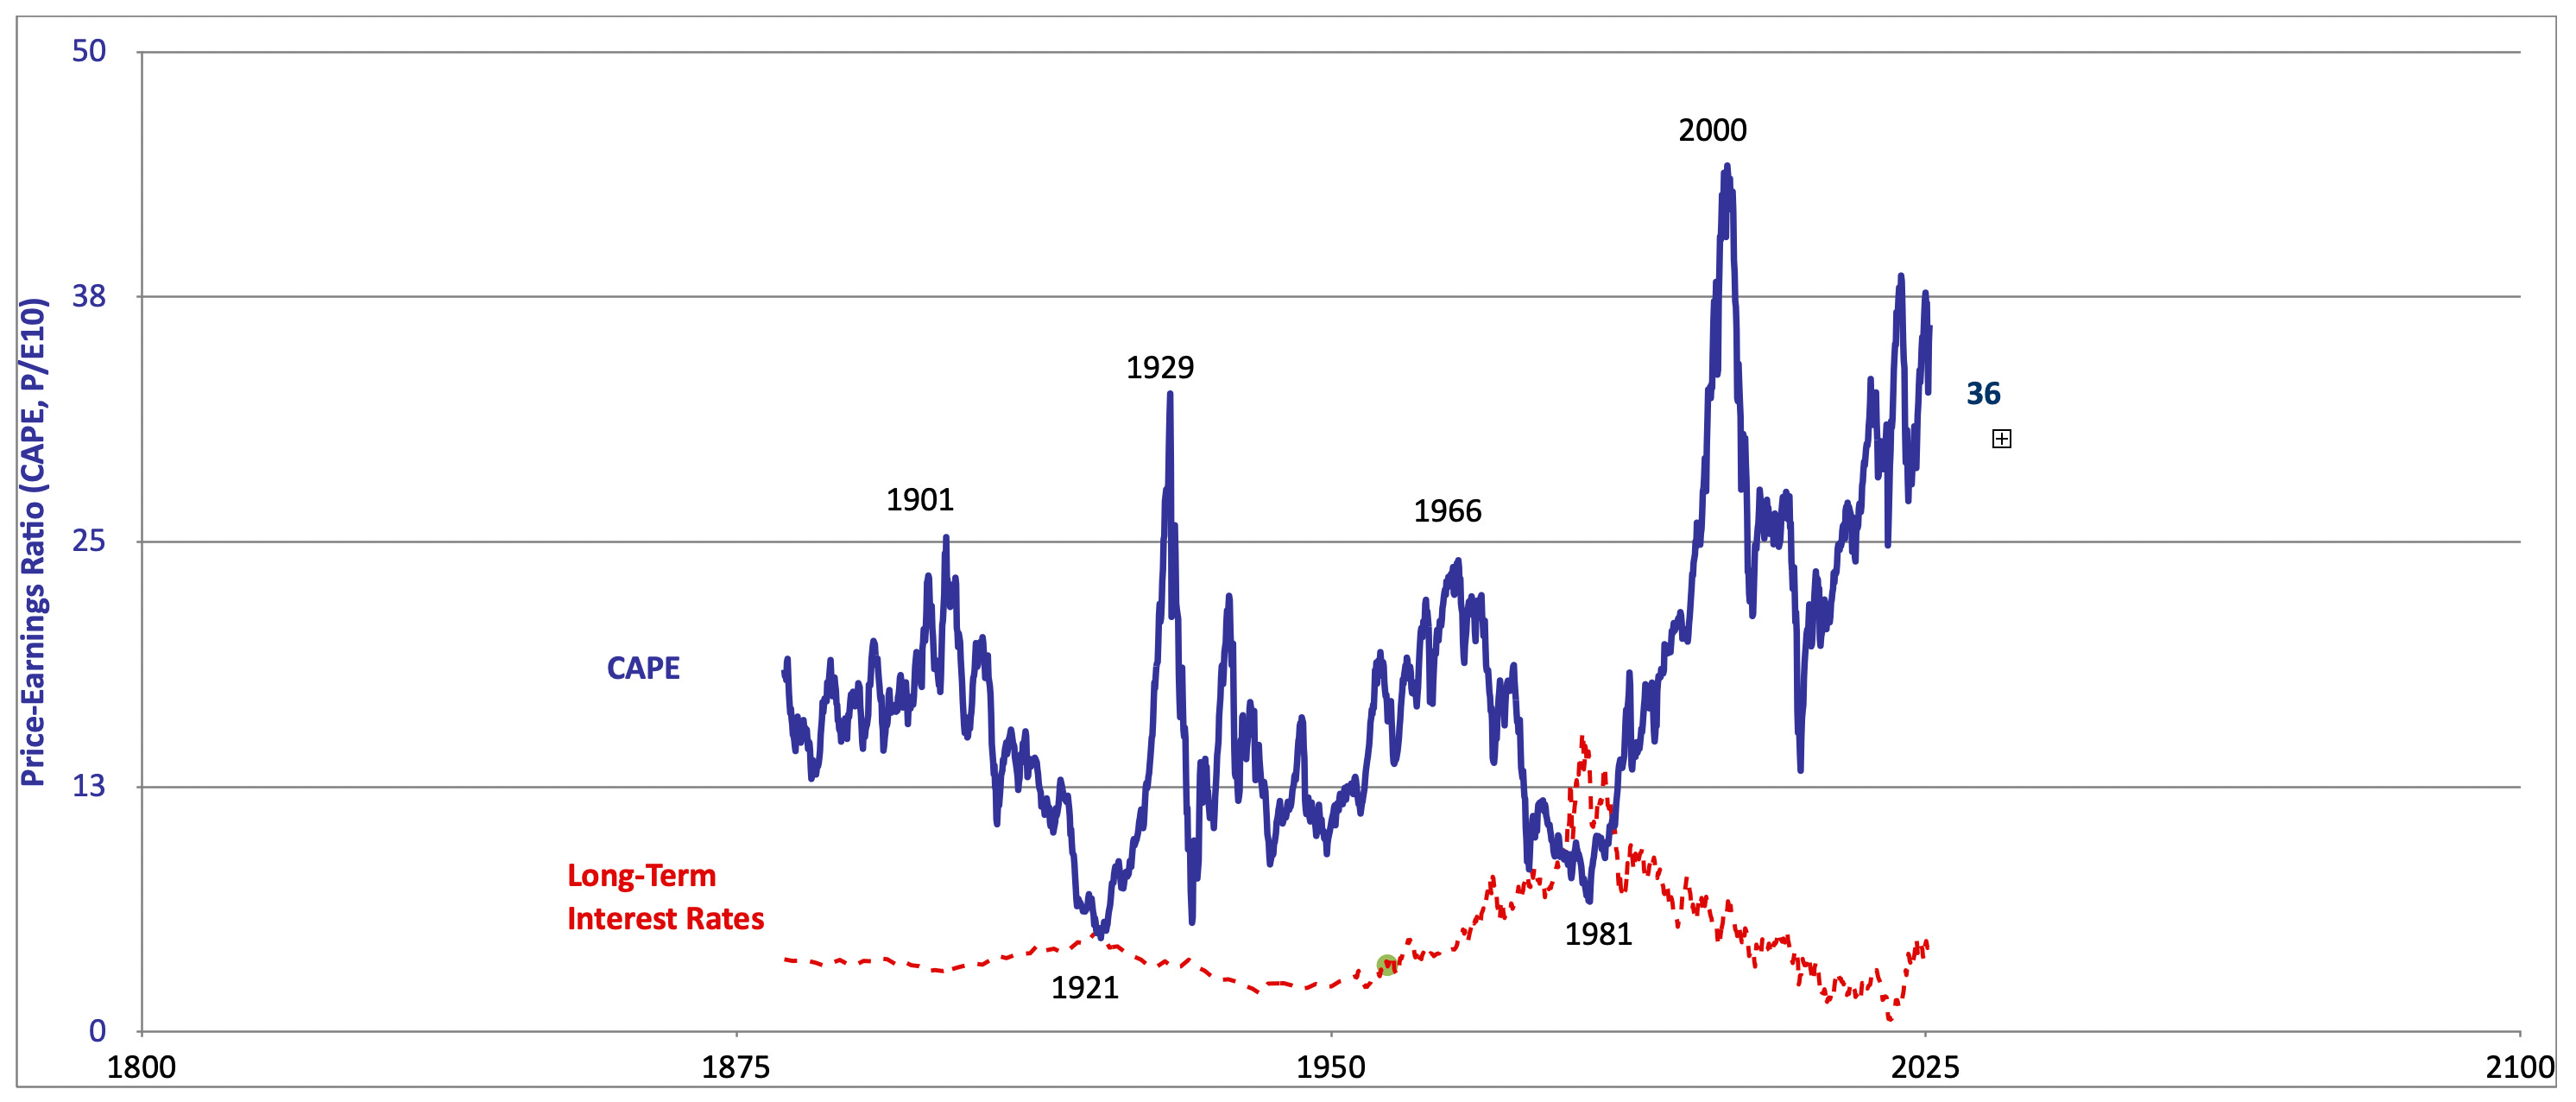
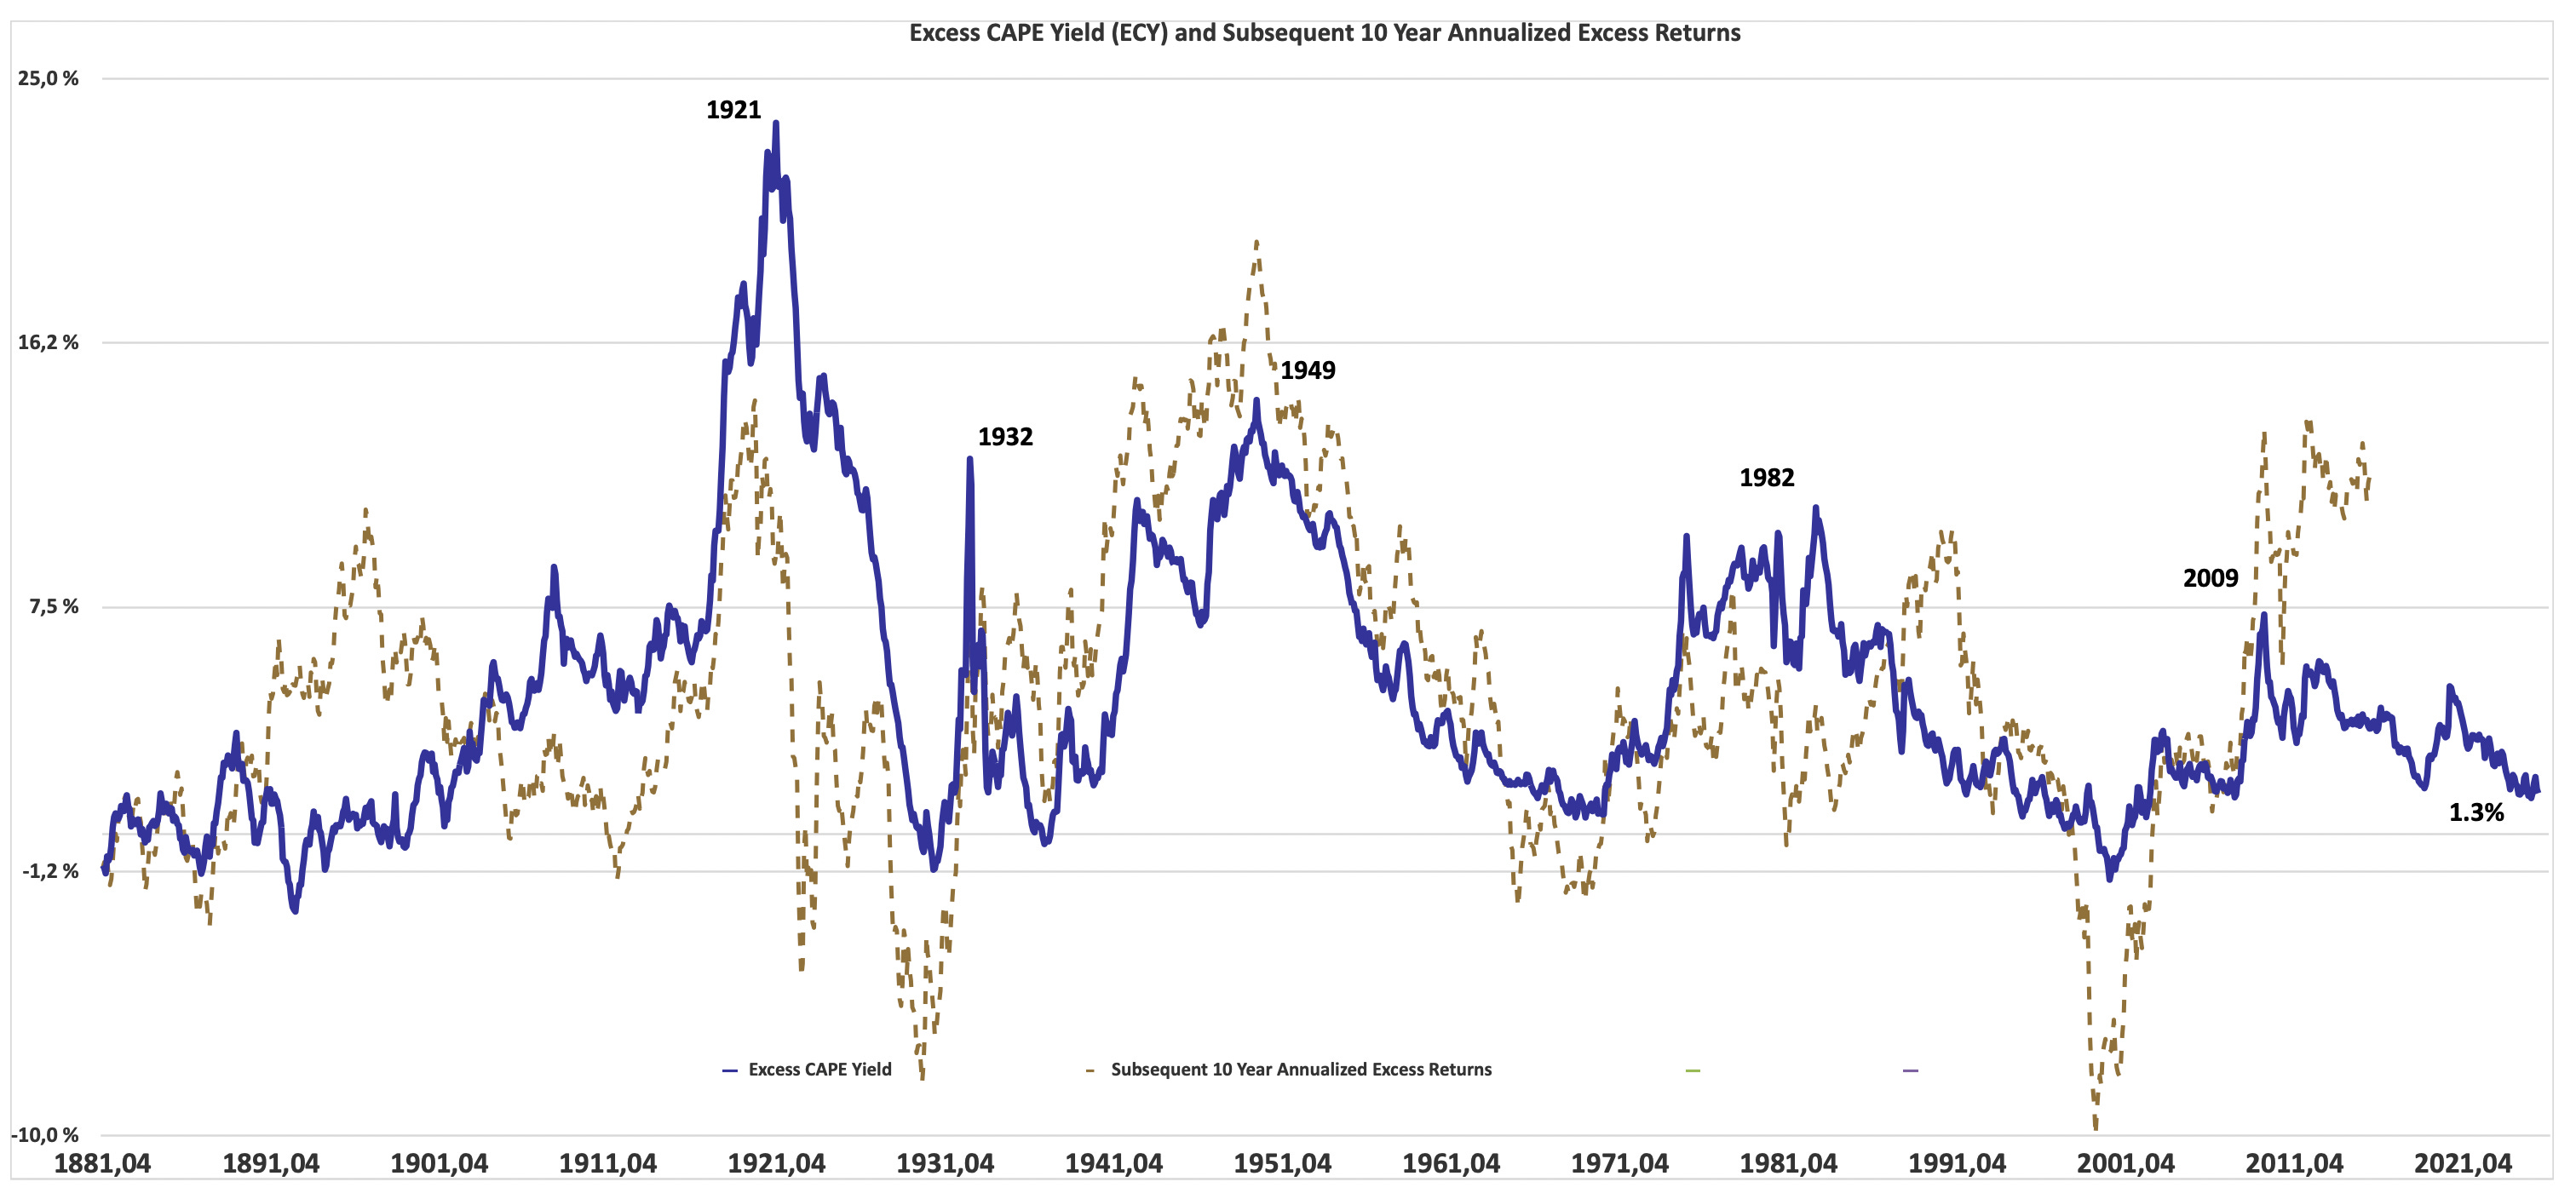
While the ratio was higher at the peak of the Y2K bubble, the current level is at the very top of the historical range. The flip side of this ratio is the CAPE excess yield, effectively comparing it to the prevailing “risk free rate.” Currently, the excess is 1.3%, which is so low that returns from similar starting points have typically been negative over the subsequent 10 years.
Price to Sales
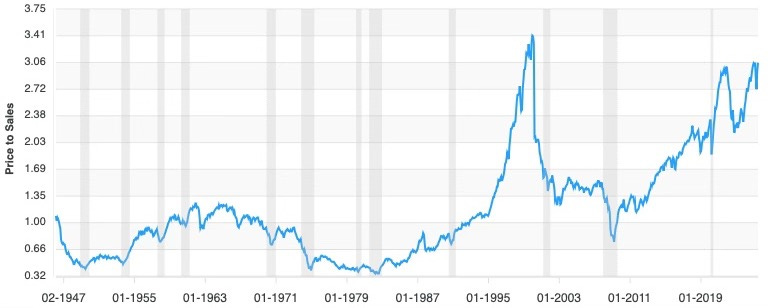
This ratio is ultra-simple and for that reason extremely informative on the prevailing view of future growth potential: There is no (significant) ability to manipulate it.
Sales are (mostly) sales and the very top-line in a P&L—the number that lies ahead of all possible adjustments. Its simplicity, combined with our analysis of corporate profitability, can be instructive in understanding how much has been priced into current share prices without entering a big discussion about possible exceptions.
The current value is the highest since data began after the second world war except for the Y2K bubble.
Big Bear Markets of the Past vs. Today
Given the extreme levels of the above indicators historically, it is worth examining the current situation compared to major previous stock market falls (greater than 25%) over the past 100 years. Twenty-five percent is arguably too low to highlight the real dangers, and indeed in our table we have three episodes (1987, COVID, and 2022) which hardly made a dent to investor attitudes or positioning. This wasn't the case with the other crashes included—1929, 1973, 2000, and 2007—which all altered risk appetite for years. Illustrating this is the fact that while the longest of these bear markets lasted almost three years, it took on average a decade to recover the previous peak in nominal terms.
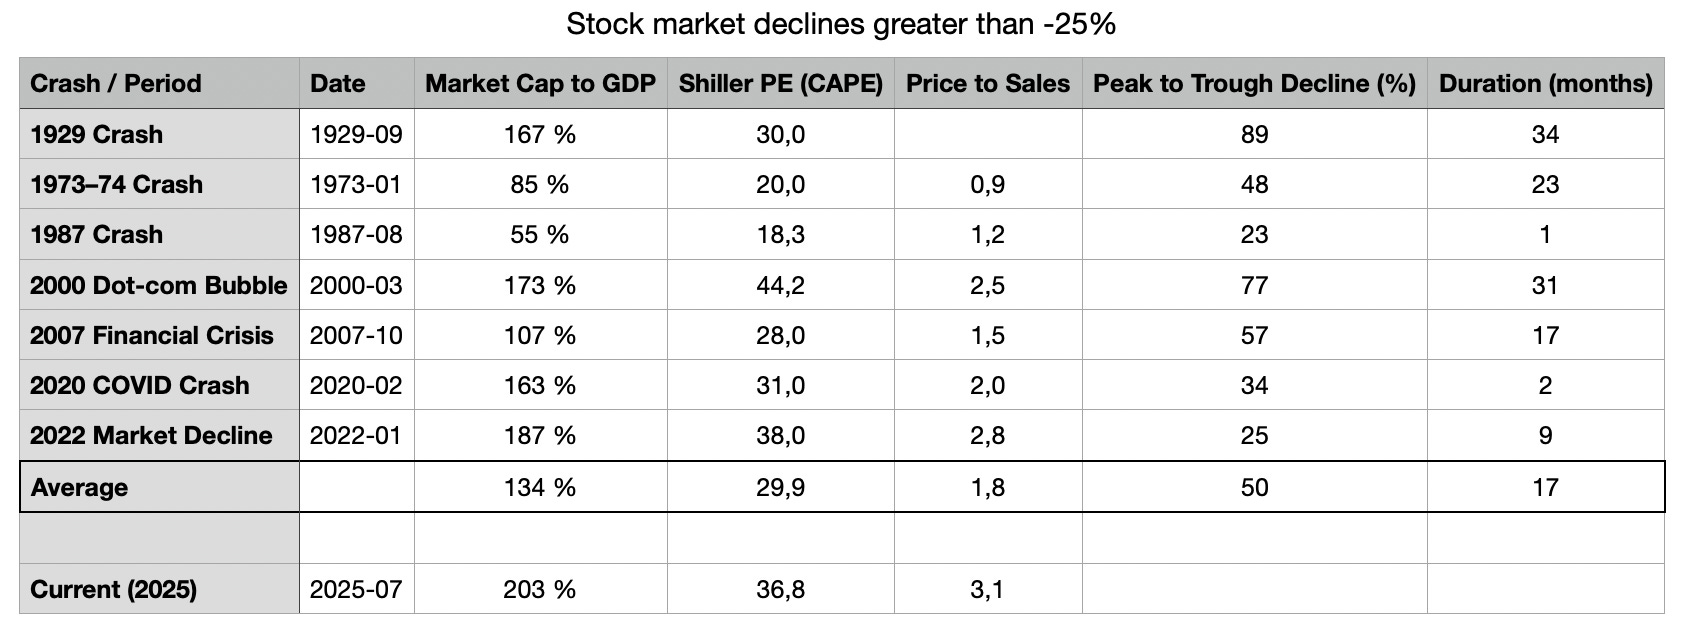
We are today well above the average valuation levels that preceded these “four mega bears,” and while that doesn't in any way guarantee a comparable outcome, we should certainly be open to exactly that possibility. A 50% decline over a two-year period seems well within the realms of possibility.
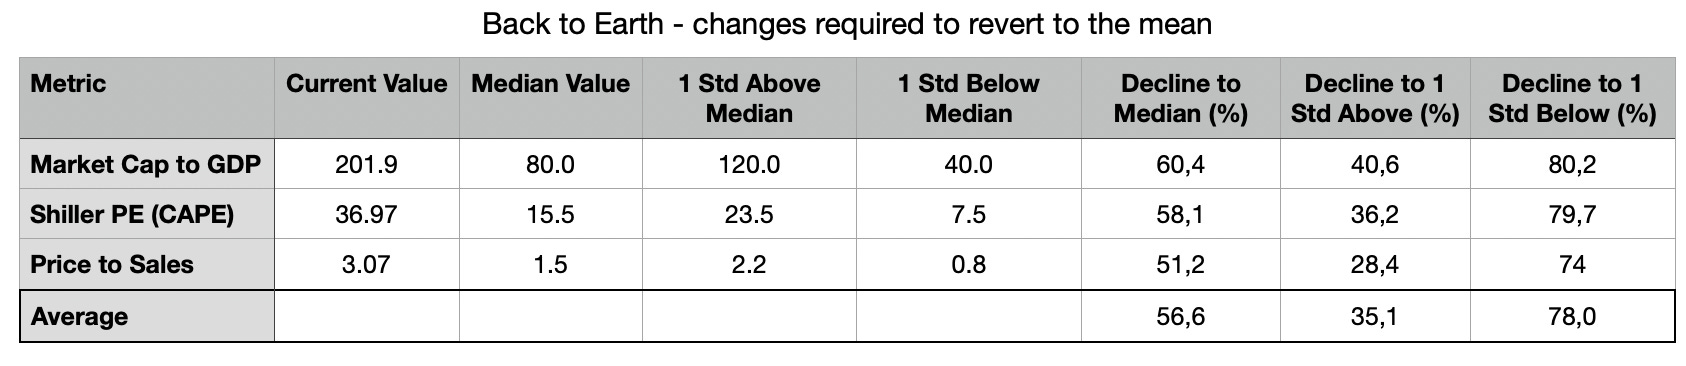
A more simplistic approach is to simply expect the market to return to some sort of historic average level. That is, after all, what we have seen regularly during the past 100 years and beyond. The table above provides a brief examination of the outcome if we were to revert towards the historic median, and it arrives at a similar conclusion to our review of previous bad bear markets. But of course, markets are not linear machines; instead, they tend to overshoot (as we would appear to be enjoying currently) and undershoot (which we may see in the future). In this case, going to outright cheap levels would suggest a devastating three-quarters fall.
Final Thoughts 1: A Quick Look at the USD
Anyone visiting the US today knows intuitively that the exchange rate is expensive. That anecdotal conclusion is well supported by formal valuation measures such as the Real Effective Exchange Rate shown above.
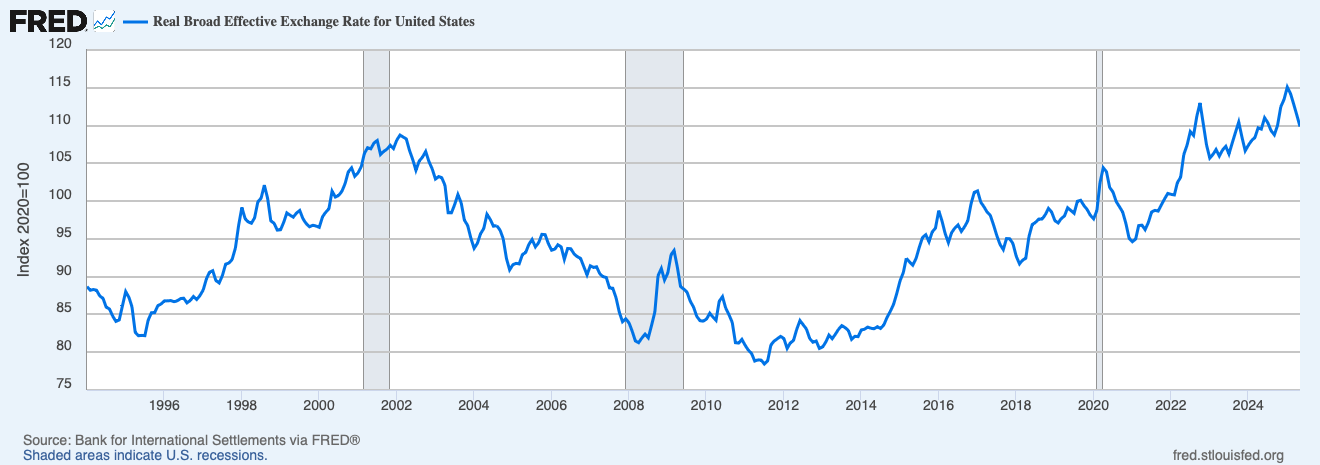
Indeed, the long-term average on this measure is 94 (vs. the current reading of 109, down from 115 in January), meaning it is currently 1.8 standard deviations above its long-term mean. A return to the mean would result in a 14% decline; an overshoot to one standard deviation below would mean a 22% fall to 85.
Ultimately, determining exact fair values and likely extended moves for currencies is even more uncertain than for equities. Nonetheless, it is clear that the Dollar today has appreciated sharply and likely deviated substantially to the upside from its fair value—starting around the global financial crisis of 2008. Consequently, it had become expensive, and although the recent decline which began in January this year has started to reverse that, it would seem only the beginning.
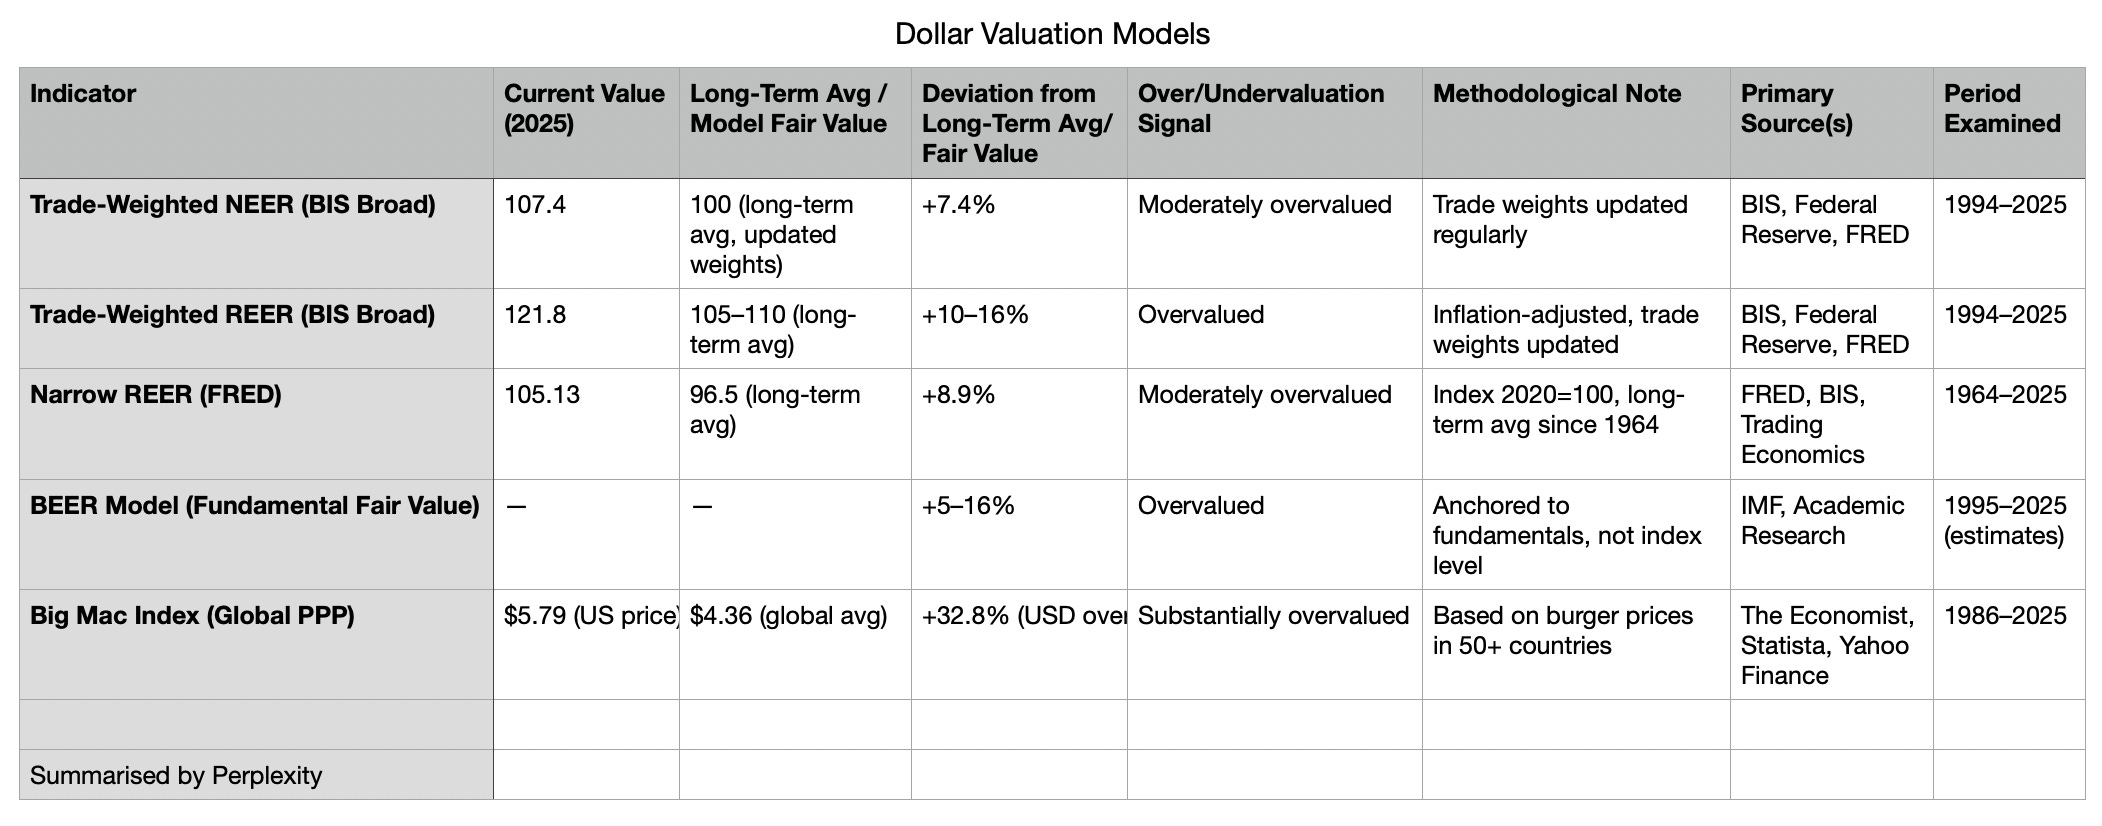
For example, for the DXY to return to its long-term, declining trend, it could easily return to the 80s and potentially, in an overshoot, to the 70s. It is worth noting that whenever the index has gone down through its 10-year moving average, it has historically continued to fall for many years after.
Finally, we should note that it would appear to have become official policy to advocate for a lower dollar. Given the fundamental state—even if everything is relative in exchange rates—it would seem one of the more straightforward objectives to achieve for American politicians. For investors, the takeaway is clear: the dollar is expensive, and its recent decline is likely only the commencement of a longer journey back towards fair value (and possibly, beyond).
Final Thoughts 2: Other Possible Positives
To end this rather negatively biased piece, a few words on some potentially positive offsets.
Firstly, and most obviously, it must be said that there is absolutely no guarantee that market prices will be the only or even primary way for valuations to return to more normal levels. Indeed, if we were to experience a major productivity boost from AI or other new technology which in turn would take earnings growth beyond what is already expected, it is conceivable that valuations could fall even while prices remained flat. It is just that there has been no historical precedent for such an outcome at valuation levels comparable to where we find ourselves today.
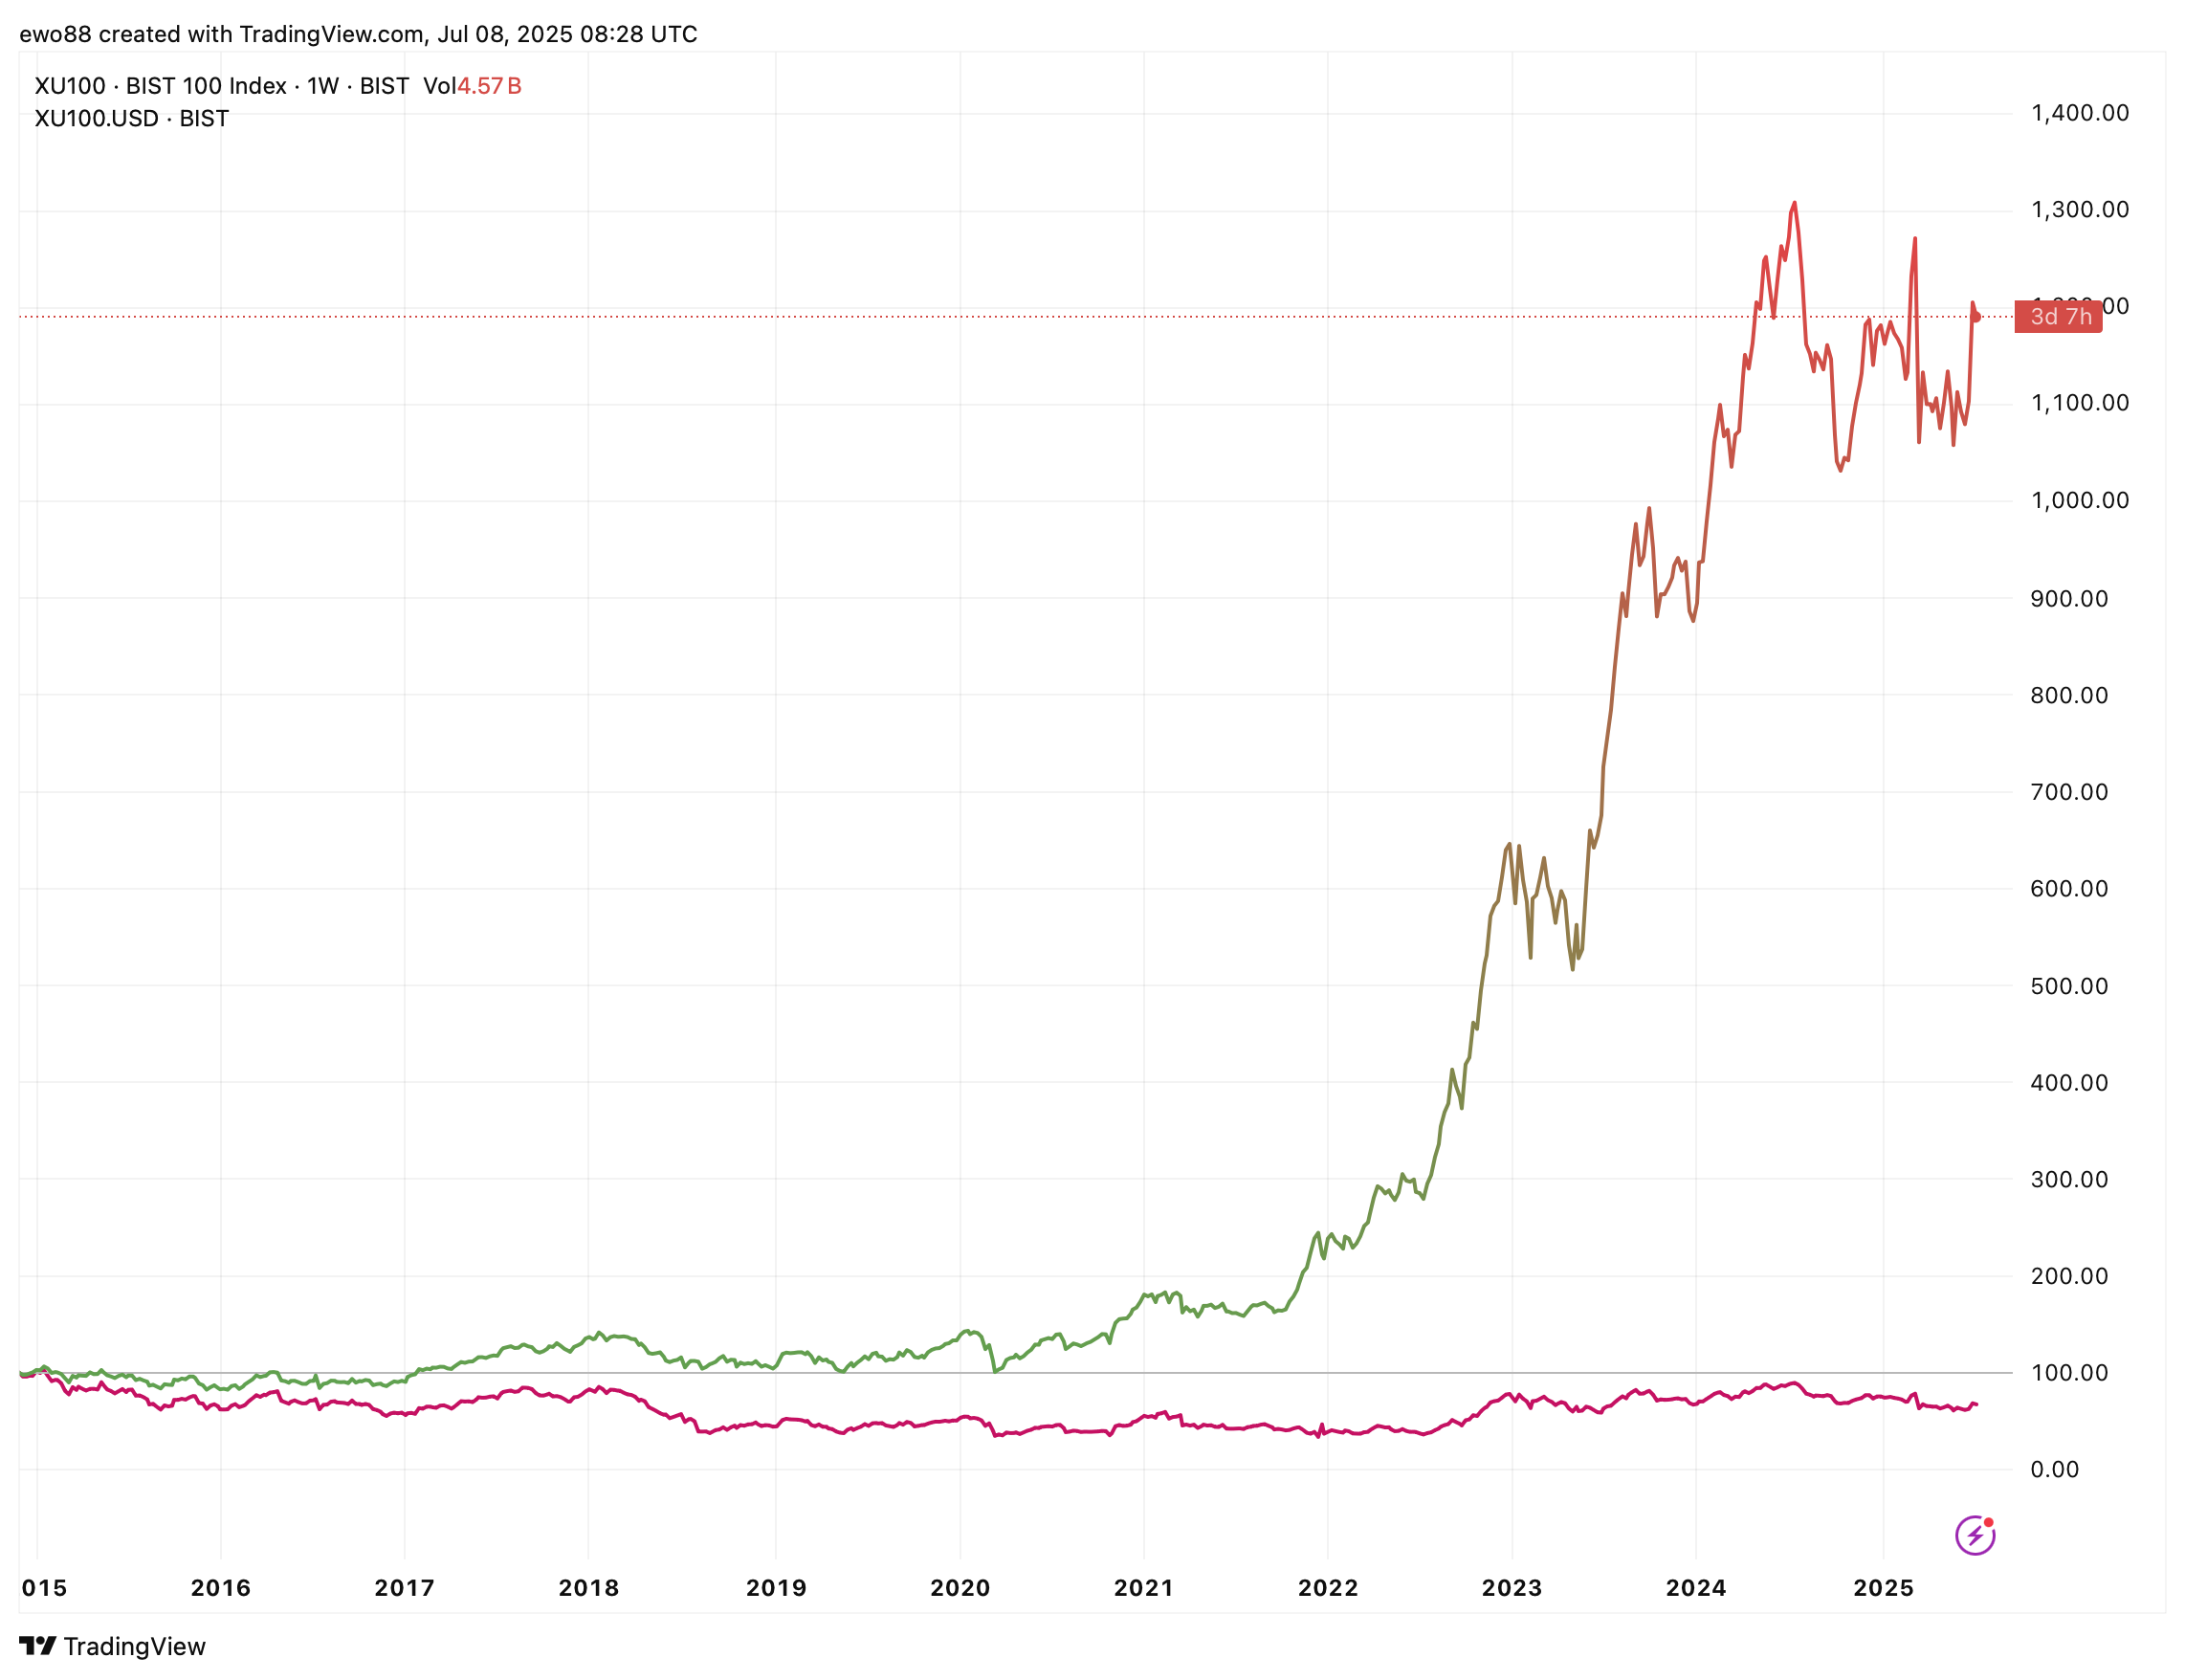
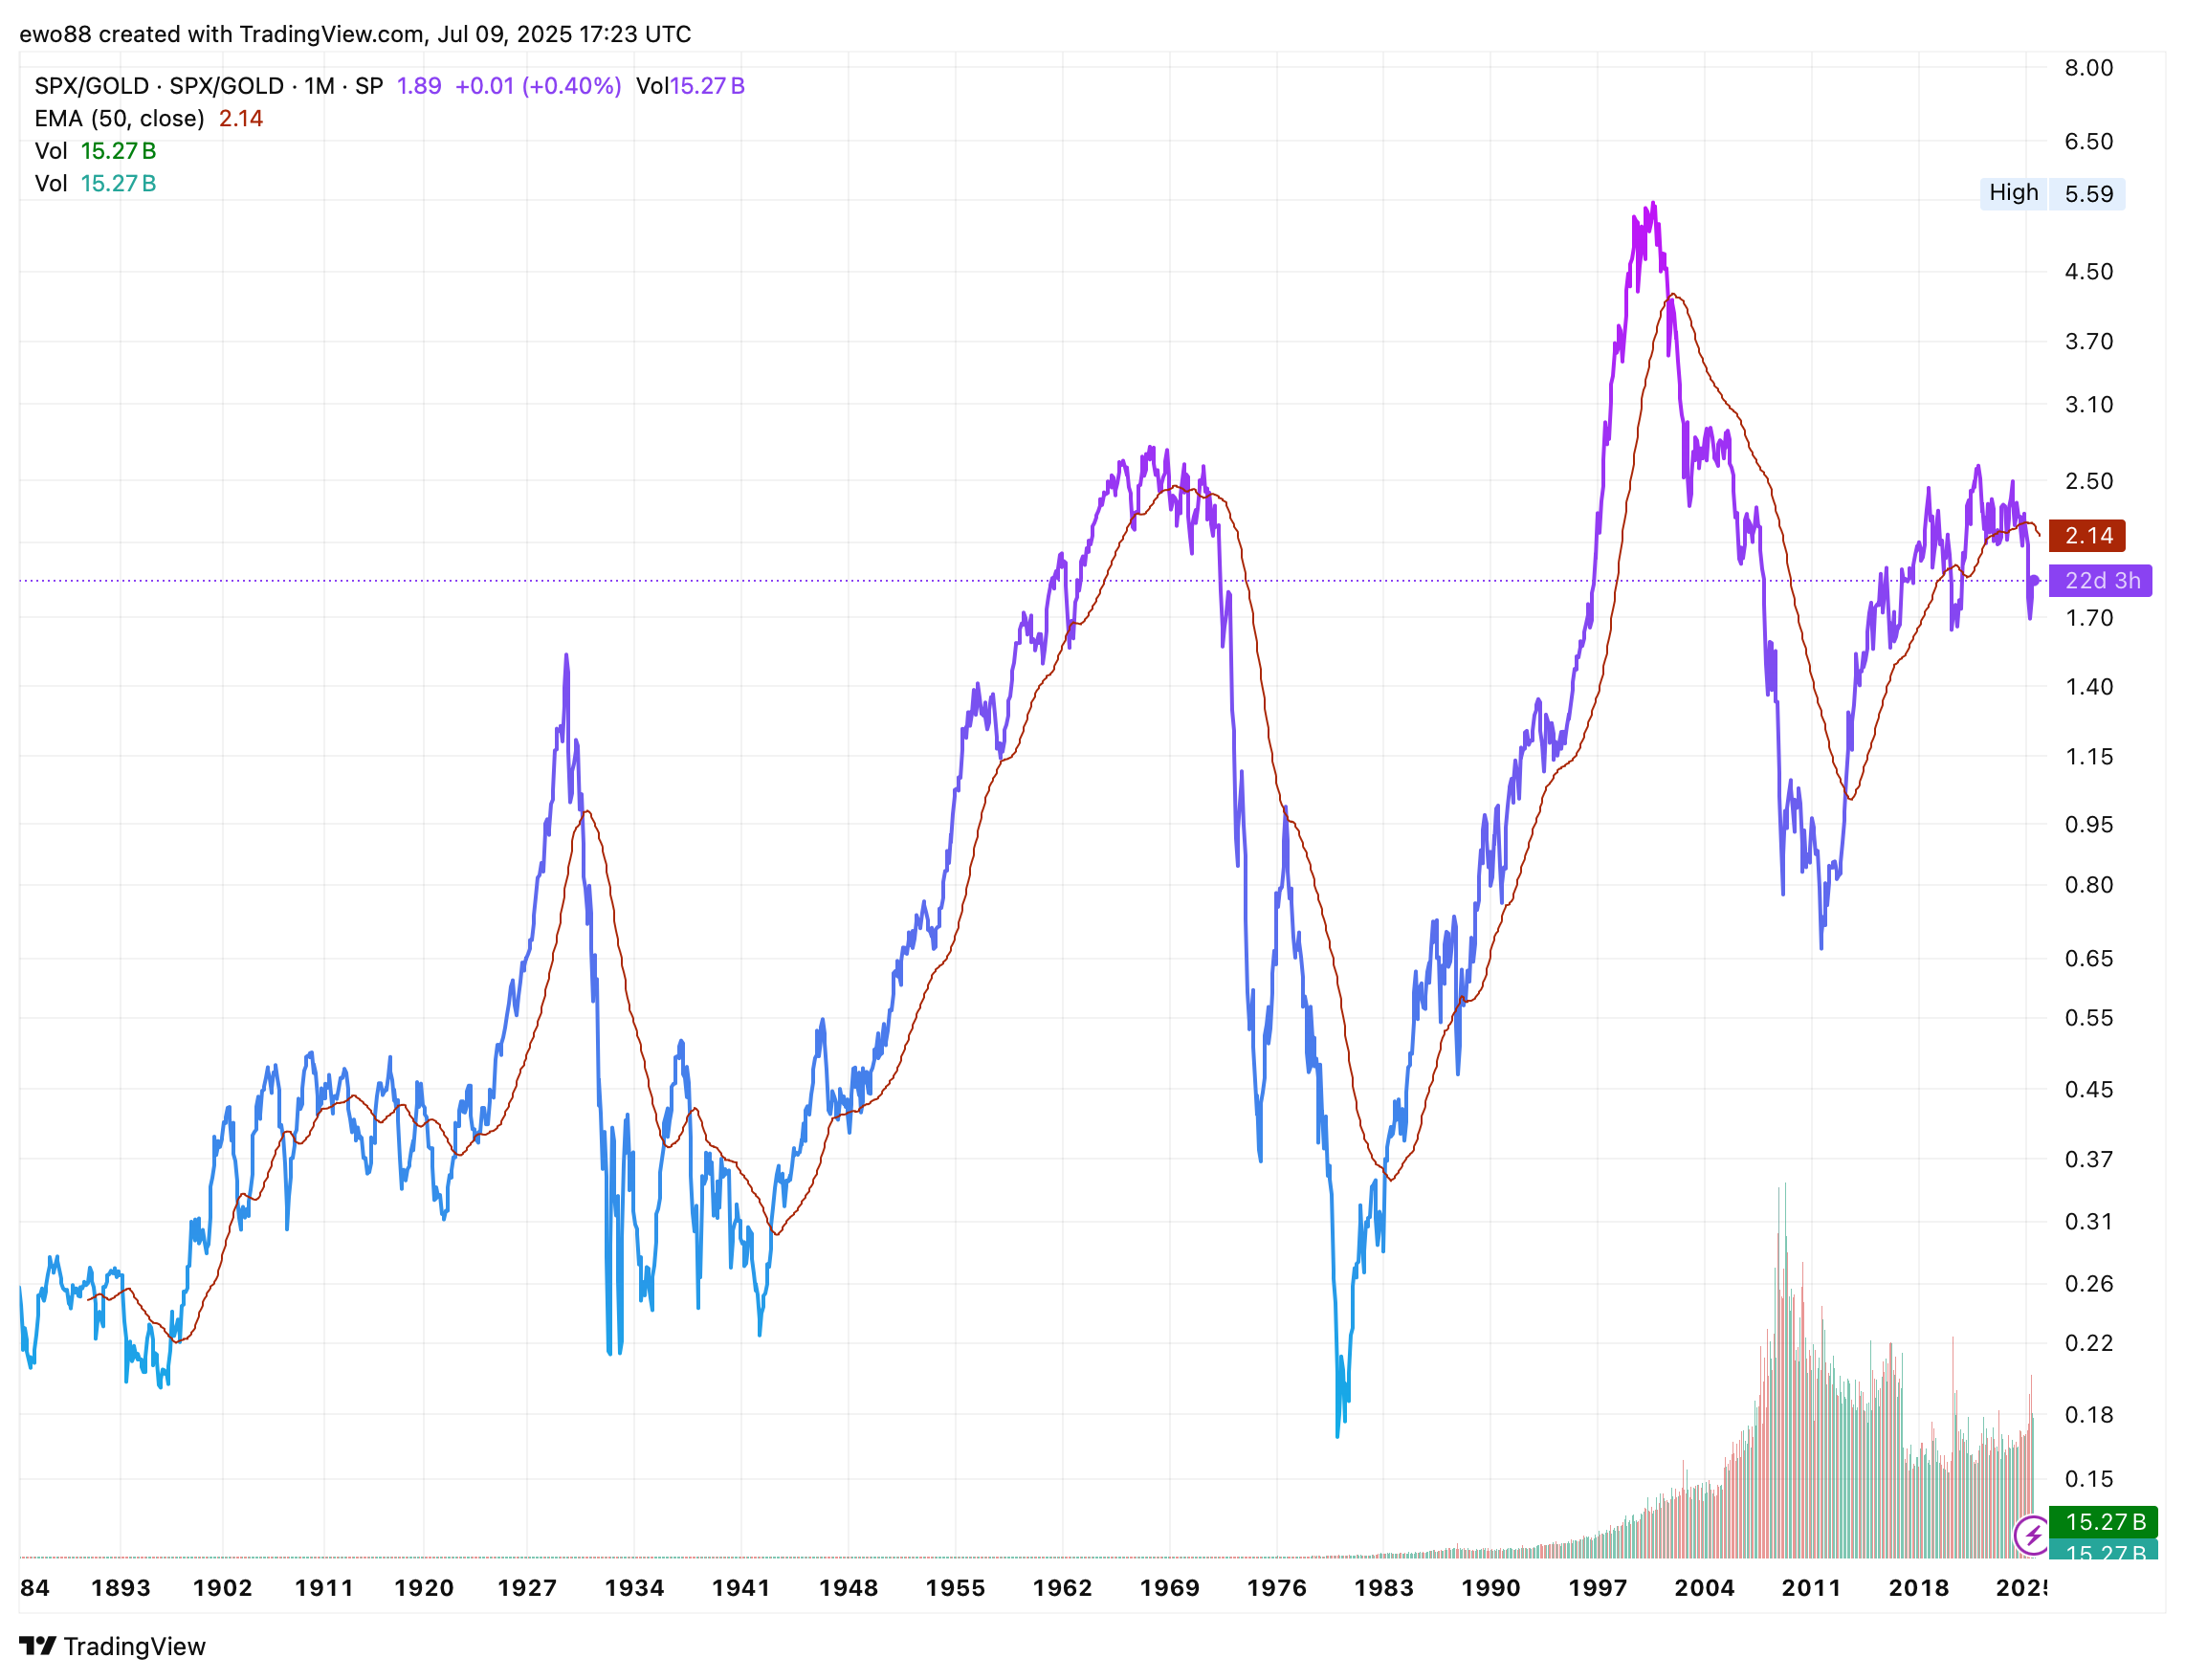
Another possible positive option is that the new paradigm of central banking, slowly introduced since 2008 and then dramatically so after COVID, will remain in place, providing ever more liquidity for financial assets and thereby supporting—even expanding—valuations indefinitely. This is a distinct possibility since the pressure on the real economy which would arise from a sharp market correction is likely too great for authorities to accept. However, it seems very unlikely that another round of QE or similar intervention would not meaningfully mark down the value of the currency, certainly relative to hard assets. In other words, it will accelerate the debasement of purchasing power already well established. There are plenty of real-world examples across the emerging markets for how this can play out; below you can see the Turkish stock market in both local currency (Lira) and USD terms. Of course, the US stock market in gold terms is already breaking down.